
If you source steel from China on a recurring basis, you already know the frustration: the price a supplier quoted on Monday is not the price you will see the following Monday. Learning how to track steel prices week by week is the difference between a procurement budget you can defend and a series of invoices that keep surprising you. The good news is that you do not need a Bloomberg terminal or a paid analyst — you need a short list of the right indexes, a simple tracker, and the discipline to update it every Friday.
This guide walks through exactly what to watch, where the data comes from, how to turn an index number into a realistic FOB China target price, and how to spot the “too good to be true” offers that waste weeks of your time. We use the same workflow internally at Yihang Metal to set our weekly price snapshots, so everything below is what we actually do, not theory.
Why Steel Prices Move Weekly and Why “the Quoted Price” Is Only a Snapshot
Steel is a commodity, and like every commodity its price is set at the margin by supply, demand, inventory, and the cost of the raw materials that go into it. The reason prices move weekly — not monthly — is that the input chain reprices continuously:
- Iron ore trades daily on the Singapore Exchange (SGX) and the Dalian Commodity Exchange (DCE), and the 62% Fe CFR China benchmark is published every working day.
- Coking coal and met coal reprice on negotiated cargoes that clear weekly.
- Scrap prices in major consuming regions (Turkey, the EU, East Asia) reset on a weekly or bi-weekly cycle.
- LME metals (nickel, zinc, copper, aluminum) settle daily, and these flow directly into stainless, galvanized, and aluminum product costs.
- Chinese HRC futures (SHFE rebar and HRC) trade with daily settlement and weekly open-interest shifts that signal sentiment.
So when a supplier sends you a quotation, that number reflects raw-material and futures prices as of that day — often as of that morning’s mill adjustment. A quotation valid for three days is, in effect, a snapshot of a moving market. If you treat it as a fixed reference and come back two weeks later, you will either be pleasantly surprised or, more often, asking why the number went up.
The buyers who consistently land good prices are not the ones who negotiate hardest on a single quote — they are the ones who know how to track steel prices before they ever ask for the quote.
The Four Price Layers Every Buyer Should Know: Raw Material → Billet/HRC → Mill Ex-Works → FOB China
One of the biggest mistakes we see is comparing a raw-material index number directly to a supplier’s FOB quote. They are not the same thing; there are four layers in between, and each one carries a spread. Walk the chain from the bottom up:
| Layer | What it is | Typical driver | Where to see it |
|---|---|---|---|
| 1. Raw materials | Iron ore 62% Fe, coking coal, scrap, LME nickel/zinc/aluminum | Global mining supply, freight, FX | SGX, DCE, LME, Mysteel, SteelOrbis |
| 2. Billet / HRC / slab | Semi-finished and flat-product benchmark prices | Mill utilization, inventory, futures | SHFE HRC futures, Mysteel HRC index, CRU HRC |
| 3. Mill ex-works | What a Chinese mill charges a domestic buyer, ex-mill | Order book, regional demand, energy cost | Mill list prices, Mysteel domestic reports |
| 4. FOB China | Export price including VAT rebate handling, export docs, port charges | Export parity, rebate policy, vessel availability | SteelOrbis export, Mysteel Global, supplier quotes |
Each transition between layers carries a spread that is roughly stable in normal markets and breaks down in volatile ones. The most important spread to understand is mill ex-works → FOB China, because it includes the export VAT rebate (currently 13% for most steel categories, but it has been cut to 0% on some products during export-restriction cycles), port handling, and the trader’s or exporter’s margin. When the rebate changes, FOB prices can move 5–8% overnight with no change in the underlying mill price — and that is not the supplier’s fault.
Key Indexes and Data Sources for Overseas Buyers (Free + Paid)
You do not need all of these. You need the two or three that match your product. But it helps to know the landscape so you can pick — and once you know how to track steel prices against the right sources, the rest of your buying process gets dramatically easier.
| Source | Free / Paid | What it covers | Best for |
|---|---|---|---|
| LME (London Metal Exchange) | Free delayed / paid real-time | Nickel, zinc, copper, aluminum, lead cash & 3-month settlement | Stainless (nickel), galvanized (zinc), copper/aluminum products |
| SHFE (Shanghai Futures Exchange) | Free | Steel rebar, HRC, wire rod futures; copper, aluminum, zinc, nickel | HRC and rebar sentiment, Chinese domestic price direction |
| Mysteel / Mysteel Global | Mostly paid; free headlines | Daily Chinese HRC, rebar, plate, coil, billet, raw-material assessments; export FOB | The reference for Chinese domestic and export flat/long products |
| SteelOrbis | Paid (some free news) | Weekly export FOB assessments by product and origin | Direct FOB China benchmarks for export buying |
| Fastmarkets | Paid | Global HRC, plate, rebar, scrap, pig iron assessments; export and import | Cross-regional price comparison, formal contract settlement |
| S&P Platts | Paid | HRC, plate, slab, scrap benchmarks across regions | Formal market benchmarks, long-term contract indexation |
| MEPS | Paid | Monthly and quarterly global steel price averages by product | Long-term trend tracking, multi-country comparison |
| CRU | Paid | Detailed HRC, plate, slab, raw-material indices with methodology | Raw-material-to-steel cost modeling |
For most overseas buyers, the practical free stack is LME delayed settlements + SHFE daily settlement + Mysteel free headlines + one paid export assessment (SteelOrbis or Mysteel Global). That combination will tell you 90% of what you need to know about where the FOB China price is heading next week.
What to Actually Watch, by Product
Tracking every index is noise. Track the ones that drive the specific product you buy. Here is the mapping we use internally:
| Product | Primary driver(s) to watch weekly | Rule of thumb |
|---|---|---|
| Stainless 304 / 316L | LME nickel 3-month + ferro-chrome (Chinese domestic) | Nickel is ~60–70% of 304’s cost; a 10% move in LME nickel typically moves 304 coil ~5–7% |
| Carbon HRC / plate | Iron ore 62% Fe CFR China + coking coal + SHFE HRC futures | Iron ore + coal ≈ 40–50% of HRC cost; HRC futures lead spot by ~1 week |
| Galvanized / PPGI | HRC substrate + LME zinc + coating/processing spread | Zinc is ~5–8% of GI coil cost; substrate is the dominant factor |
| ZAM / Zn-Al-Mg | HRC substrate + LME zinc + LME aluminum + Mg premium | Same as GI but aluminum and magnesium add a secondary layer |
| Aluminum sheet / coil | LME aluminum 3-month + alumina (AEX / Chinese domestic) | LME aluminum is ~70% of 1xxx sheet cost; fabricating spread is stable |
| Section / beam (H-beam, angle, channel) | Billet price + SHFE rebar futures | Long products track billet more closely than iron ore |
The reason this matters: a buyer of galvanized coil who watches LME nickel is watching the wrong number. A buyer of 304 who watches iron ore is watching the wrong number. Match the index to the alloy.
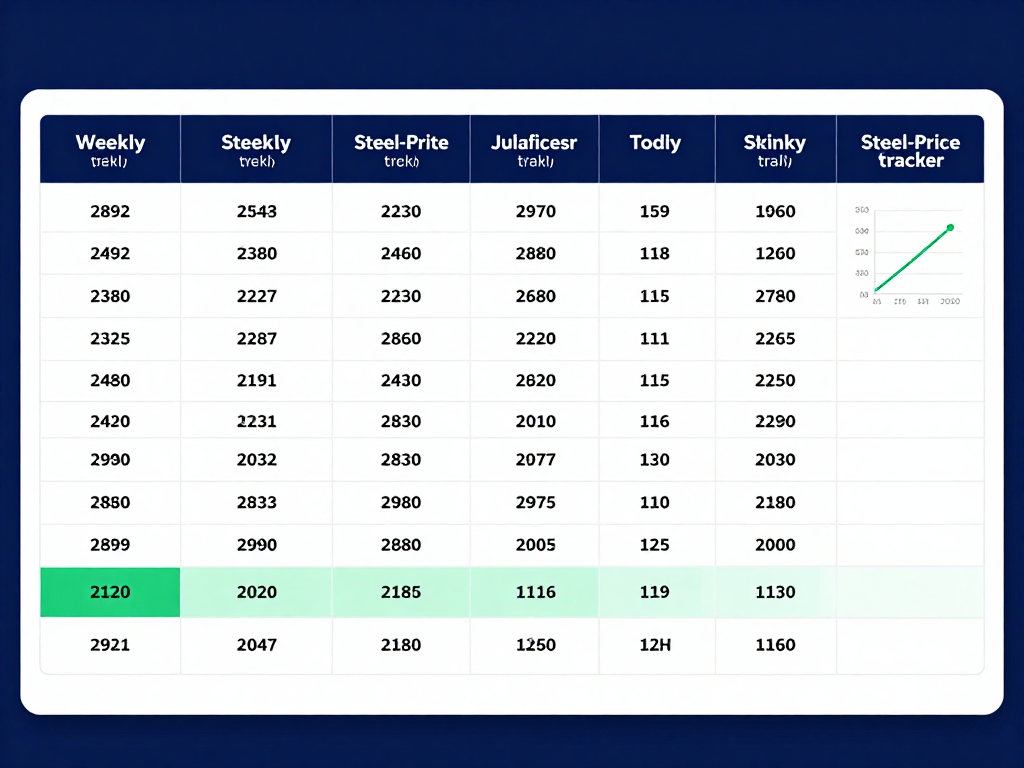
How to Track Steel Prices Week by Week: Build a Simple Weekly Tracker (Google Sheet Template, 5 Columns)
You do not need a paid platform to do this well. A free Google Sheet, updated every Friday in 15 minutes, will outperform most “market intelligence” subscriptions because the value is in the consistency, not the tool. Here is the structure we recommend:
| Column | What to enter | Source |
|---|---|---|
| A — Date | Friday’s date | — |
| B — Raw material | e.g., Iron ore 62% Fe CFR China (USD/mt), or LME nickel 3M (USD/mt) | SGX / Mysteel / LME |
| C — Intermediate | e.g., SHFE HRC front-month settle (CNY/mt), or billet Tangshan | SHFE / Mysteel |
| D — Export benchmark | e.g., SteelOrbis HRC FOB China (USD/mt) | SteelOrbis / Mysteel Global |
| E — My target FOB range | Calculated: D ± 3% as your negotiation band | Formula |
Add a second tab with a simple line chart of column B and column D over time. Within four to six weeks you will start to see the lead-lag relationship between the raw-material line and the FOB line — and that visual is what tells you whether a supplier’s quote is leading or lagging the market.
A few practical setup notes:
- Use the same currency and unit each week. Mixing USD/mt and CNY/mt is the most common spreadsheet error. Pick USD/mt for FOB and keep a separate cell for the USD/CNY rate.
- Record the source and timestamp. A price without a source is not data — it is gossip. Add the source in a comment or a notes column.
- Record the quote validity. When you log a supplier quote, log how many days it is valid for. A 3-day quote and a 30-day quote are not comparable.
- Update on the same weekday. Friday afternoon China time is the cleanest snapshot because it captures the week’s mill adjustments before the weekend lull.
How to Translate an Index Into a Target FOB China Price Range (Mill Spread Rule of Thumb)
This is the step most buyers skip — and it is the one that turns raw indexes into actionable negotiation numbers. The idea is simple: a Chinese mill’s FOB price equals its raw-material cost plus a processing spread that is fairly stable in normal markets. Once you know the spread, you can estimate the fair FOB price from public raw-material indexes.
The mill spread rule of thumb for the main flat products:
- HRC FOB China ≈ (iron ore 62% Fe CFR China × 1.6 + coking coal × 0.5) + mill conversion + export handling. The 1.6 and 0.5 are rough tonnage coefficients (it takes roughly 1.6 t of ore and 0.5 t of coal to make 1 t of crude steel, before yield losses). The conversion + handling spread has historically landed in a USD 80–150/mt band depending on the cycle.
- GI / ZAM coil FOB ≈ HRC substrate + zinc/alloy coating cost + galvanizing spread. For Z275 GI, the zinc add-on is roughly (LME zinc USD/mt × 0.00275) per square meter, times the coil’s m² per ton. The galvanizing line spread is typically USD 60–120/mt.
- Stainless 304 coil FOB ≈ (LME nickel × ~0.08 + ferro-chrome) + melting/AOD conversion + rolling spread. Nickel dominates. A USD 1,000/mt move in LME nickel moves 304 coil roughly USD 80–120/mt.
You do not need these to be precise. You need them to be in the right neighborhood so that when a supplier quotes HRC at USD 580/mt FOB and your model says fair value is USD 640–680/mt, you immediately know to ask why — and the answer is usually either (a) non-prime material, (b) thin-coating or off-spec substrate, or (c) the quote is stale and will be revised.
Your target FOB range is the index-based fair value ± 3%. Quotes inside that band are normal market offers. Quotes 8–10% below the low end are red flags, not bargains.
Red Flags: Stale Prices, Ex-Works vs FOB Confusion, “Too Low to Be Real” Offers
Once you have a tracker and a target range, the warning signs become obvious. The three we see most often:
1. Stale prices
A supplier quotes a price from two or three weeks ago without flagging that the market has moved. If your tracker shows HRC has risen USD 40/mt since the quote date and the supplier’s number has not moved, ask for a requote with a fresh date stamp. Honest suppliers will requote; traders fishing for inquiries will not.
2. Ex-works quoted as FOB
This is the single most common — and most expensive — confusion. A Chinese domestic ex-works price does not include VAT rebate handling, inland freight to port, port charges, export documentation, or ocean freight. If a number looks 8–12% lower than your target FOB range, the first question is not “great, how do I pay?” — it is “is this ex-works or FOB?” Ex-works numbers can look like FOB numbers if you do not check, and the gap is exactly the size of the rebate plus port costs.
3. “Too low to be real” offers
When HRC is trading at USD 650/mt FOB and you receive an unsolicited offer at USD 540/mt, the offer is not a bargain — it is a hook. The material is almost always one or more of:
- Non-prime / secondary — off-gauge, surface defects, coil anomalies. Fine for some applications, useless for others, and not what your RFQ asked for.
- Wrong standard — Q195 substrate quoted against an ASTM A36 or EN 10130 RFQ. The price is real; the material is not equivalent.
- Under-coating — Z120 sold as Z275, AZ100 sold as AZ150. The coating-mass test on the MTC will catch this if you insist on EN 10204 3.1/3.2.
- Bait-and-switch — the offer price exists only to get you to reply; once you commit time, the “real” price appears.
The tracker protects you against all three. If the offer is outside your ±3% target band, treat it as a signal to verify, not to celebrate.
How to Ask a Supplier (Yihang Included) for a Price-Formula or Quarterly Contract Instead of Spot-Only
Spot buying is fine for one-off purchases, but for recurring volume it is exhausting and leaves you exposed to every weekly swing. Most serious Chinese exporters — Yihang included — will offer a formula-based or quarterly fixed price if you ask, because predictable volume is valuable to them too.
Three structures to ask for, in order of sophistication:
- Quarterly fixed price. We agree a price for a quarter based on the index at the start of the quarter. Simple, predictable, best when you have stable volume and the market is range-bound. Risk: if the market moves sharply, one side is unhappy, but over a quarter the pain is bounded.
- Monthly index-linked formula. Price = agreed raw-material index value × coefficient + fixed conversion spread. The coefficient and spread are negotiated once; the index moves the price automatically. Best for raw-material-driven products (HRC, GI, stainless). This is the structure most large importers use for container-quantity recurring buys.
- Lowest-of-spot-or-floor. A floor price protects the supplier against a market crash; you get spot upside if the market falls. More complex to negotiate but useful when you expect prices to drift down.
When you ask for a formula, bring your own numbers. A supplier who hears “we want HRC at index + USD 90/mt conversion, monthly reset, 100 mt/month for 6 months” will engage seriously; a supplier who hears “can you do a contract?” will send you the standard spot quote again. Specificity is what unlocks the formula channel.
When to Lock a Price vs When to Wait — a Simple 3-Rule Framework
Even with perfect information, the decision to commit is a judgment call. We use a simple three-rule framework that has held up across cycles:
- Lock when the price is in the bottom third of its 12-month range AND you need the material within 8 weeks. Trying to squeeze the last USD 10/mt out of a falling market is how buyers end up paying rush surcharges when the market turns.
- Wait when the price is in the top third of its 12-month range AND your requirement is more than 6 weeks out. Time is your friend when the market is extended; the raw-material index will usually correct before your vessel sails.
- Always lock if the price has moved more than 10% in either direction within 2 weeks. Volatility cuts both ways. After a 10% move, the next move is a coin flip, and the cost of being wrong is higher than the cost of being early. Lock, ship, and stop watching the ticker.
| Market position | Lead time need | Action |
|---|---|---|
| Bottom third of 12-mo range | < 8 weeks | Lock |
| Bottom third of 12-mo range | > 8 weeks | Lock or formula — low risk either way |
| Middle third | Any | Spot or monthly formula; do not over-think |
| Top third of 12-mo range | > 6 weeks | Wait — re-quote weekly |
| Top third of 12-mo range | < 6 weeks | Lock minimum needed; defer the rest |
| >10% move in 2 weeks (either direction) | Any | Lock — stop speculating |
This framework will not make you a market timer. It will keep you from making the two most expensive mistakes: chasing a falling market and freezing in a rising one.
Stop guessing where steel prices are heading. Every week, Yihang Metal publishes a concise price snapshot covering HRC, plate, GI, PPGI, ZAM, stainless 304/316L, and aluminum — with the underlying raw-material moves and our read on where FOB China is headed next. It is the same tracker we use internally, and we send it to buyers who want to negotiate from data, not from a single spot quote. Send us your product list and target volume today — we will add you to the weekly snapshot and come back with a formula or spot quote within 24 hours.